Introduction
Over the past year, we have accelerated our transition from a mining-led business into a tightly connected industrial platform spanning iron ore mining, beneficiation, pelletisation, downstream steelmaking and strategic expansion into the global copper value chain.
Year in Review
FY 2025-26 marked a shift from expansion to execution, with stronger dispatches, improved logistics and higher value-added output driving scale and performance.
Q1
A Steady Start
Stable revenue performance with stronger iron ore output offsetting softer contributions from the DRI and power segments.
Q2
Operational Momentum Builds
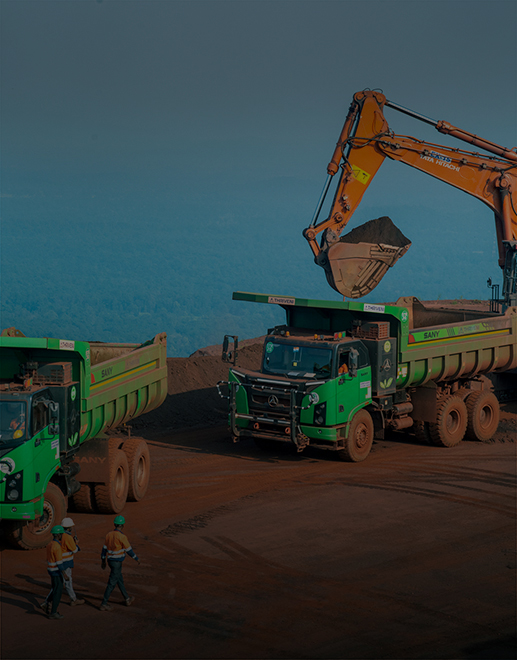
Strong improvement in iron ore evacuation following enhanced environmental clearances and the operationalisation of the slurry pipeline.
Q3
Performance Reaches New Highs
Stronger iron ore dispatches, accelerated pellet plant ramp-up and improved sponge iron volumes supported robust revenue growth.
Q4
Scaling New Operational Highs
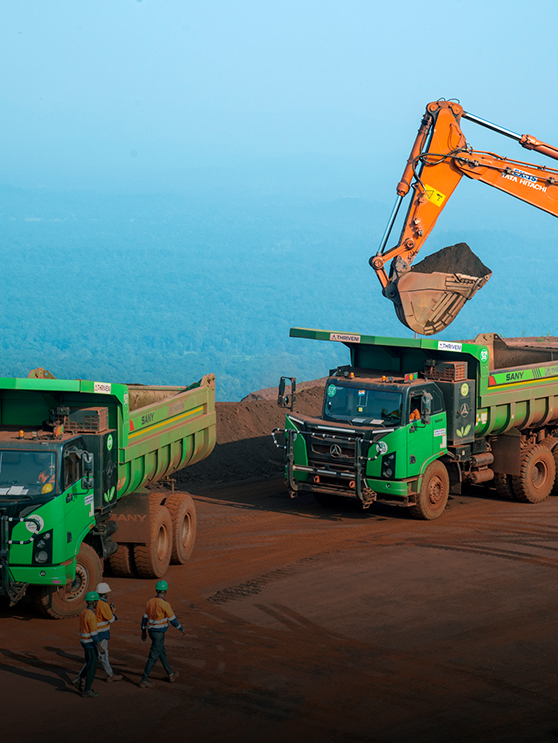
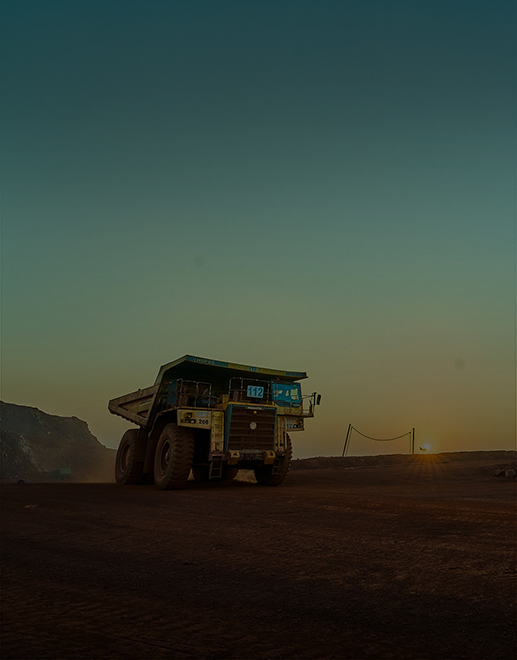
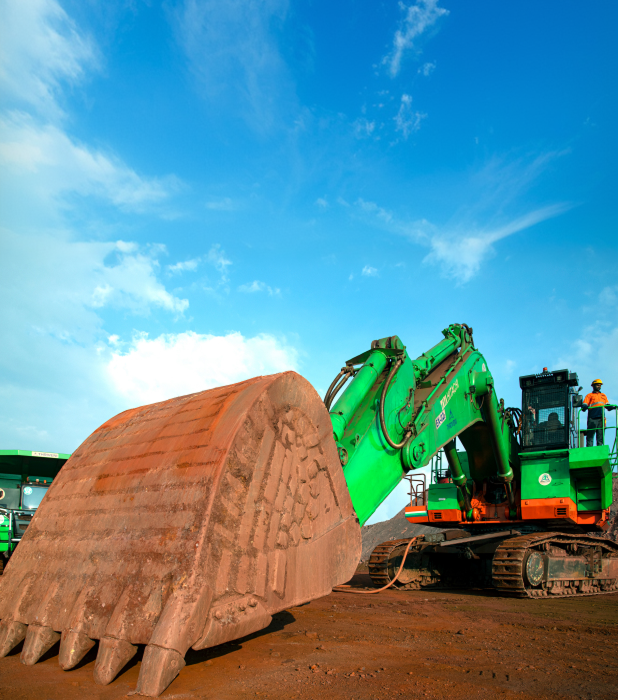
Iron ore production reached 9.1 MnT in Q4 FY 2025-26, registering a remarkable 529% Y-o-Y growth driven by the successful ramp-up of mining operations and enhanced evacuation efficiency supported by the slurry pipeline.
Message from the Chairman
Our focus on building an integrated mining-to-metal platform continues to strengthen our competitive advantage in a dynamic industry.
Read the
Mukesh Gupta
Chairman
Message from the Managing Director
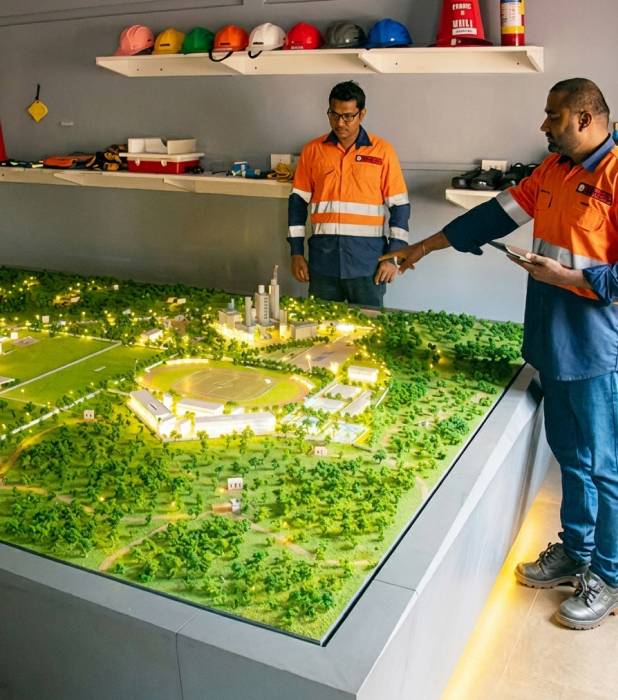
We continue to leverage and build our capabilities to create lasting social impact and scale sustainable and green mining.
Read the
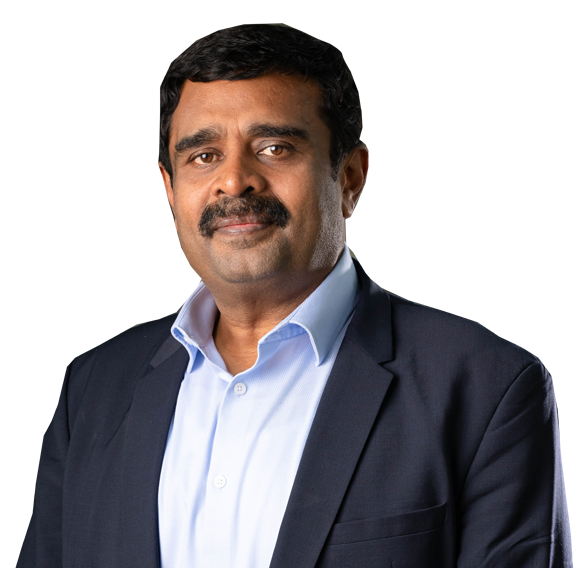
Balasubramanian
Prabhakaran
Managing Director
Message from the Managing Director
Our strategy is anchored in creating a robust and efficient value chain, from iron ore mining to value-added products.
Read the
Rajesh Gupta
Managing Director


LMEL at a Glance
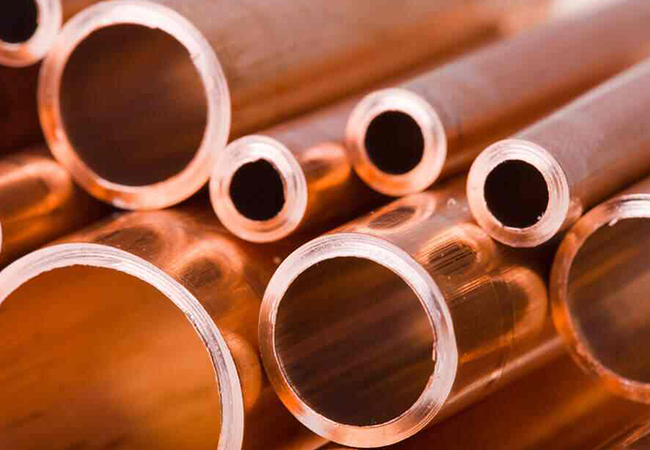
As a world-class, fully integrated player in the metals and mining sector, we are redefining the value chain through strategic expansion into critical minerals and copper while advancing strategic forward integration into steel.

Our
Vision
To be a value creator as a high-quality, low-cost, and value-added steel manufacturer; and to be the most preferred organisation for all stakeholders by fostering trust and resilience.

Our
Mission
Business Review
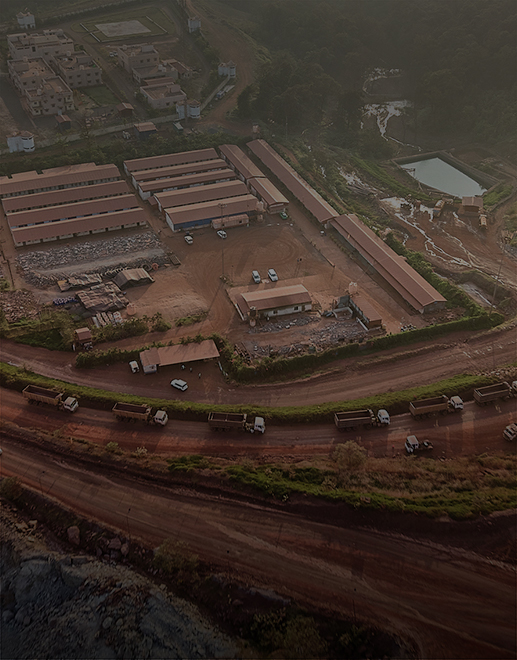
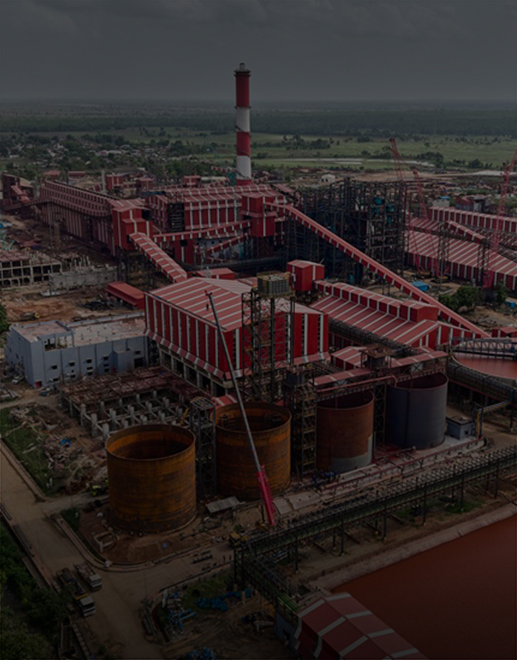
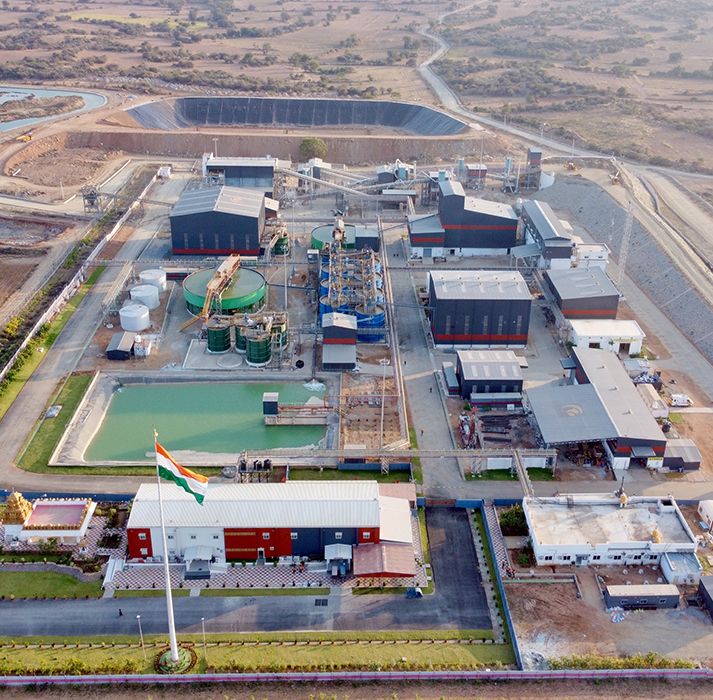
Our business portfolio spans the entire metals value chain, from iron ore mining and beneficiation to pelletisation, sponge iron production and power generation. Supported by mining services, strategic expansion into copper and critical minerals and upcoming steel manufacturing capacities, this integrated ecosystem strengthens operational efficiency, secures raw material availability and positions us to capture greater value across the mining and metals landscape.
01
₹9,394.2 crore
Iron ore revenue
73.06% Y-o-Y growth21.96 MnT
Iron ore produced
119.60% Y-o-Y growth16.18 MnT
Iron ore sales volume
71.03% Y-o-Y growth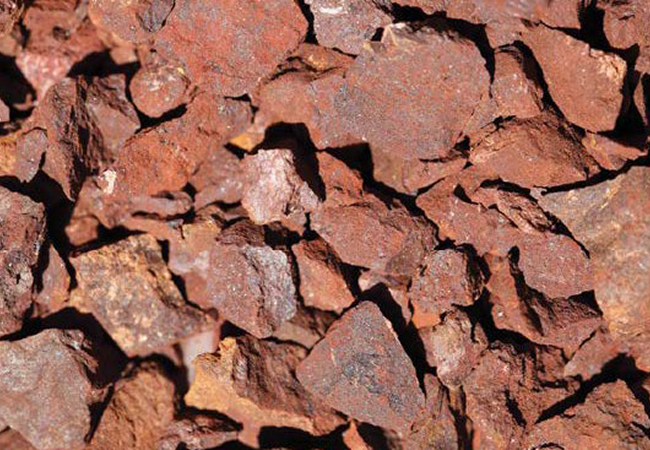

02
₹4,443.6 crore
Revenue
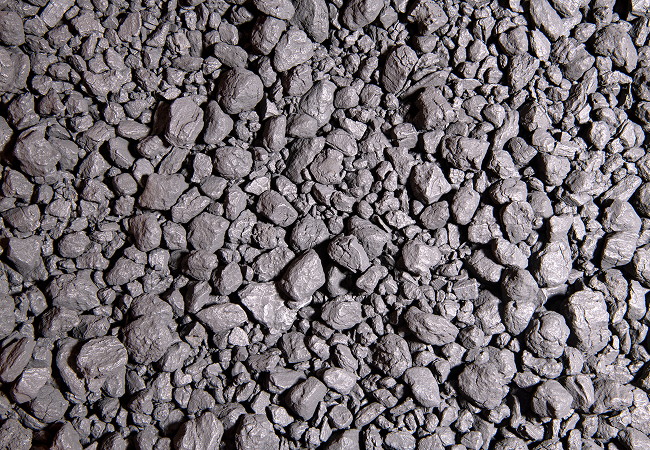
229.71% Y-o-Y growth484 kt
Sponge Iron Produced
57.03% Y-o-Y growth3.03 Mnt
Pellets Produced
03
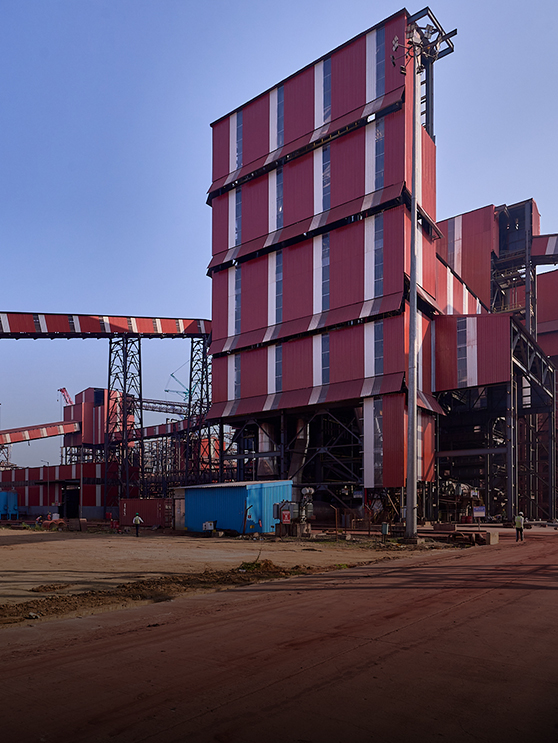
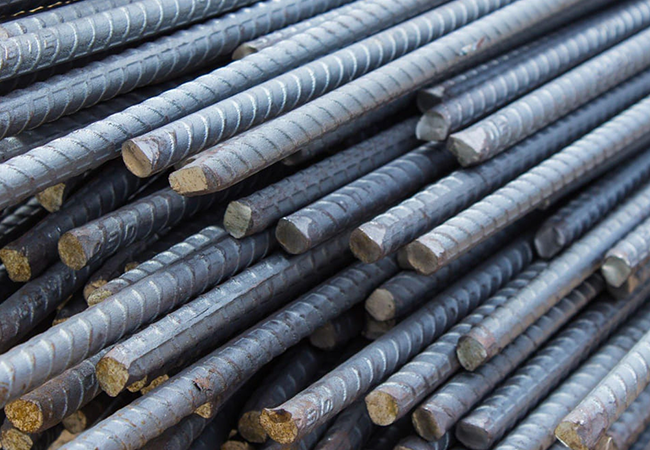
1.2 MTPA
Upcoming steel plant at Chandrapur (wire rods, round bars and TMT bars)
04
₹7,996.9 crore
Total income
20% Y-o-Y growth25.68 %
EBITDA margin
973 bps Y-o-Y growth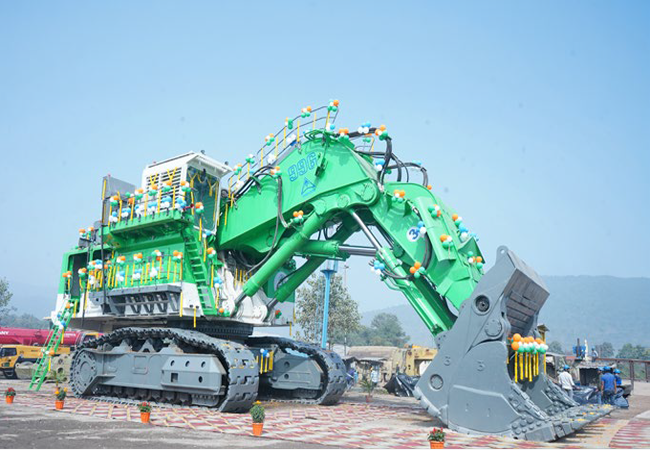
05
1,00,000 TPA
Total targeted production scale-up
16
Surya Mines licenses spanning 100 sq. km
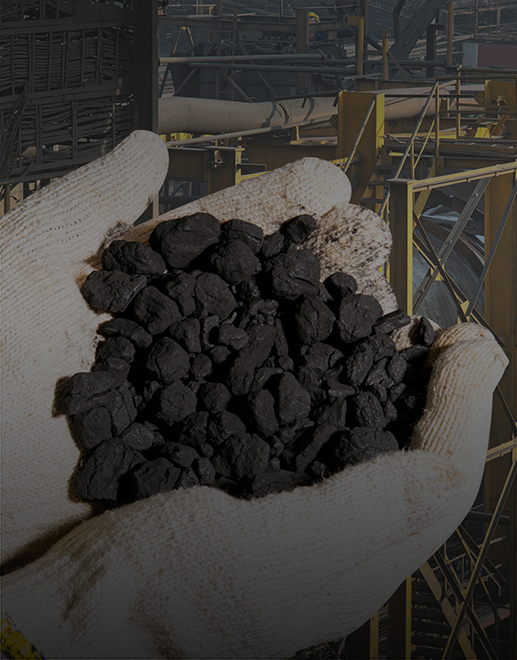
50 +
Chemaf permits supporting integrated mining and processing operations
~20,000 TPA
Targeted Chemaf cobalt capacity
Business Model

` 14,266.1 crore
Net worth
` 16,214.9 crore
Net debt

` 9,961.5 crore
CAPEX incurred
1
Iron ore mine

` 6.21 crore
Spent towards R&D
` 6.5 crore
Spent towards digitalisation

5.55 million KL
Freshwater consumption
0.25 MnT
Waste recycled and reused

4,866
Total employees
` 221.11 crore
Spent on employee well-being
100+
Training and development programmes conducted throughout the year

` 181.2 crore
Spent on CSR
8
Channel partners
34
CSR initiatives
Delivering sustainable value to all our stakeholders.
To enable sustainable and efficient delivery of value-added steel products, and be present across the value chain of steelmaking.
10
Key Stakeholders
18
Material Topics identified
9
Key risks identified
Our Strategy
` 17,306.4 crore
Income
` 6,333.9 crore
EBITDA
` 5,216.4 crore
Profit after tax
0.94
Net debt to EBITDA ratio
` 2,921.3 crore
Cash flow from operations
` 1
Dividend per share
21.96 MnT
Iron ore produced
3.03 MnT
Pellets produced
5+
Digitalisation initiatives
129,750 GJ
Clean energy used
15.28%
Reduction in GHG emissions intensity
1.8 hours
Average training hours per employee
2
Total recordable work-related injuries
0.16
Lost time Injury frequency rate
6,45,000
beneficiaries through CSR
40+
villages uplifted
Value Chain

Resource Exploration & Mine Development

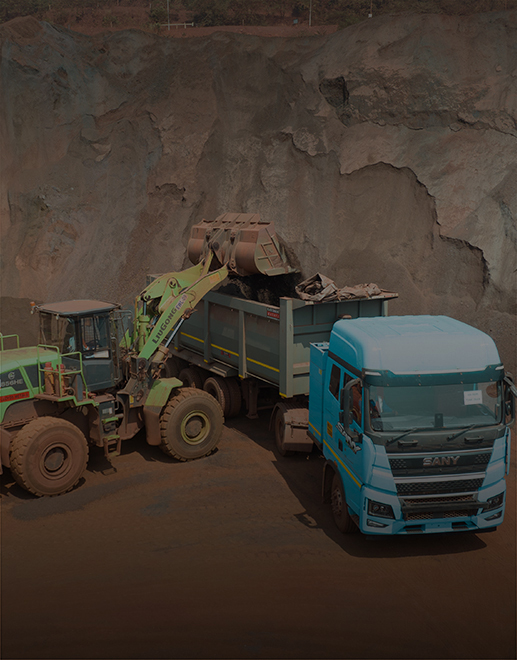
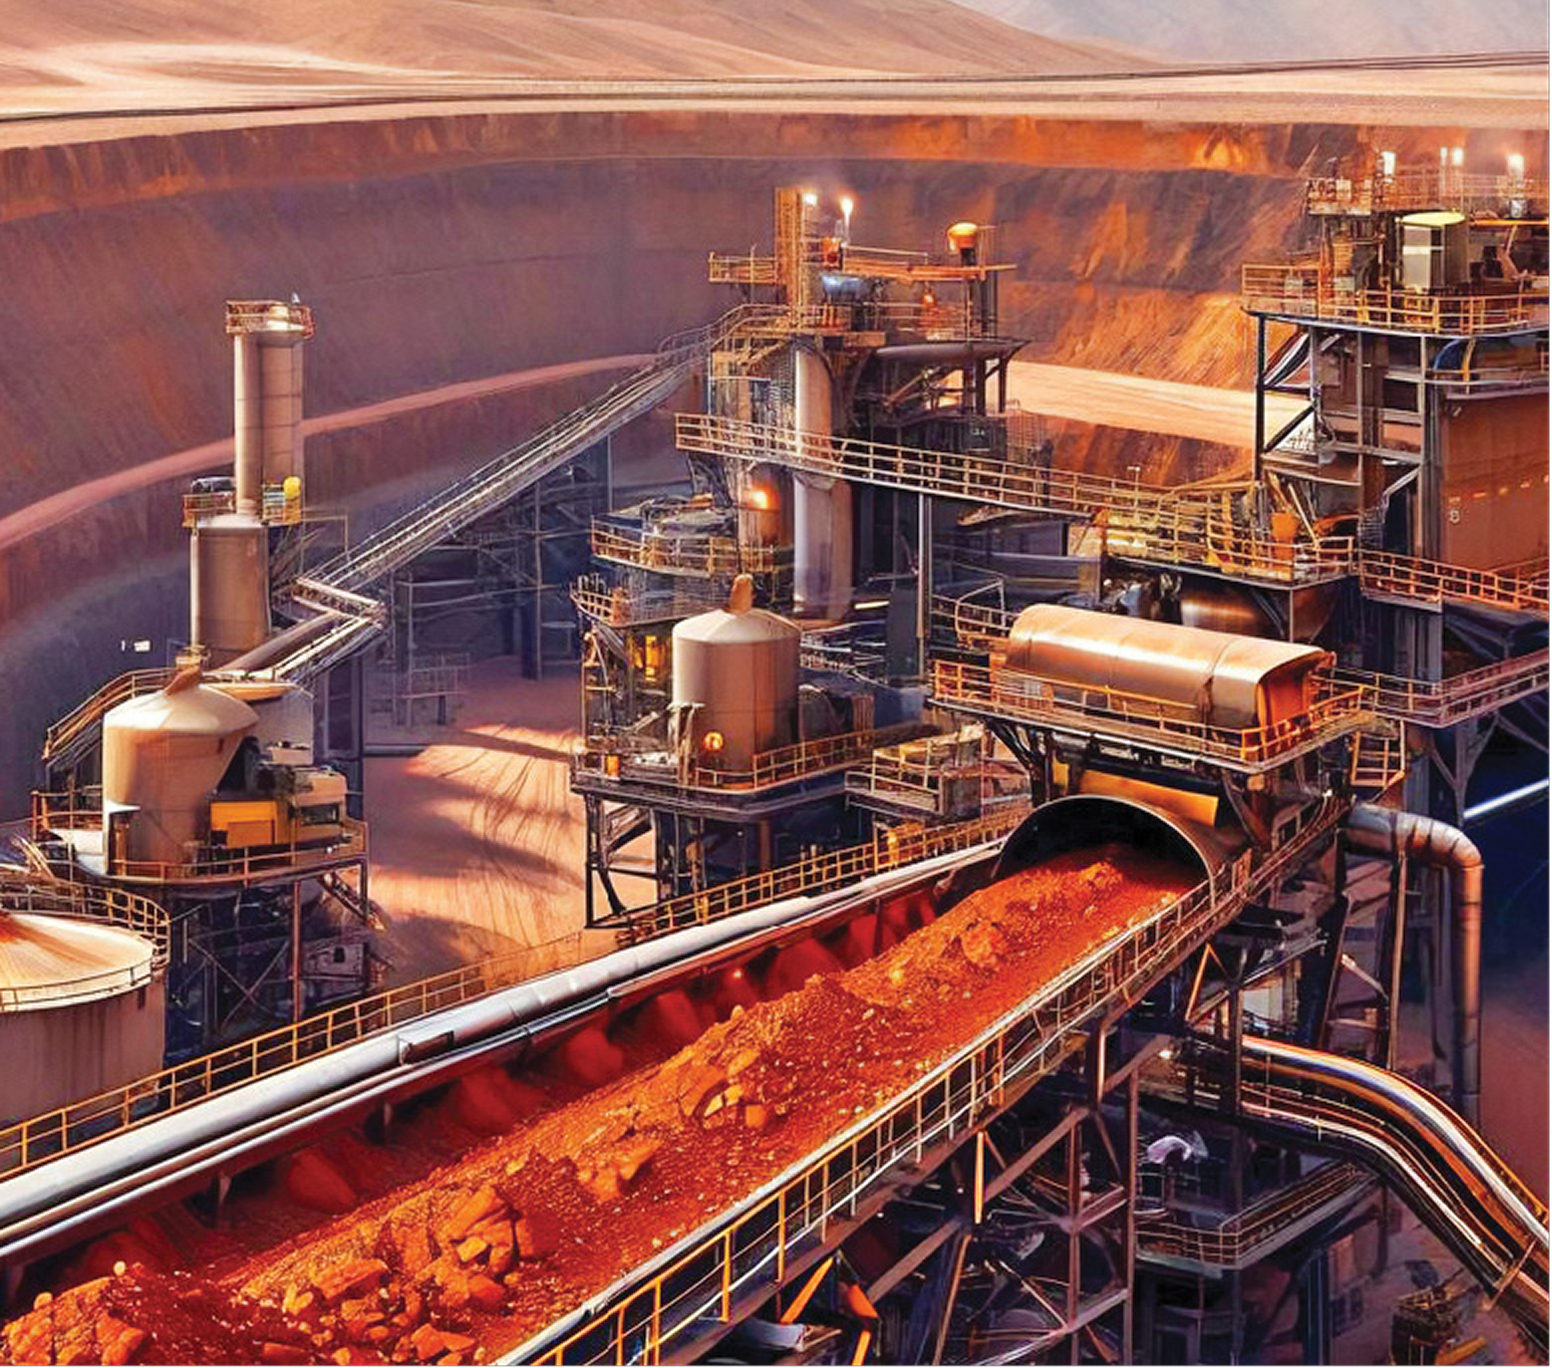
Iron Ore Mining

Ore Processing and Beneficiation

Pelletisation, DRI and Steel

Logistics and Distribution

Customer Applications & Market Delivery
Value Chain
Resource Exploration & Mine Development
Iron Ore Mining
Ore Processing and Beneficiation
Pelletisation, DRI and Steel
Logistics and Distribution
Customer Applications & Market Delivery
Stakeholder Engagement

Our customers inspire us to deliver high-quality products and experiences that consistently meet evolving needs.

Our employees are the driving force behind innovation, productivity and long-term organisational success.

We work with institutions and industry bodies to advance standards, knowledge and sectoral growth.

Our suppliers are trusted partners in building resilient, efficient and ethical value chains.

Our employees are the driving force behind innovation, productivity and long-term organisational success.

We engage constructively with government and regulators to ensure compliance and support national priorities.
Key Highlights FY 2025-26

Key Highlights FY 2025-26
Key Highlights FY 2025-26
Key Highlights FY 2025-26
Key Highlights FY 2025-26
Key Highlights FY 2025-26